
One grant maker I have been meaning to have a look at for a while now is Youthtown. I have gone to their website, copied their distributions for their financial year end 30 June, and done a spot of data cleansing. They have been a bug bear for a little while when I realised, after I had blogged about my ecosystem numbers, that I hadn’t accounted for their grants to themselves.
From their website, here are the authorised purposes of Youthtown’s distributions.
They are a reasonable player in this space. As at 31 December 2021, nationally they have around 2.3% of Class 4 machines under their management, although this varies by region: in Canterbury for example they have 4.4% of machines under management: in Waitaki that number increases to 22%.
They have a different model from some of the other for purpose Class 4 organisations, such as Air Rescue and Mainland Foundation. These guys show the distribution to the primary entities they support as a grant, whereas within Youthtown its simply in their financial accounts, not their grant distributions, as a (technical term) lump of cash to Youthtown.
I have forced the numbers to make them look like others to try to allocate those grants to a region.
From their website, here are the authorised purposes of Youthtown’s distributions.
- Development and operation of Youthtown programmes and facilities
- Encouragement and development of amateur youth sport and facilities in established and legally constituted sporting organisations
- Encouragement and development of youth outdoors and cultural activities or programmes (including art, music and drama) and facilities in legally constituted organisations in community
- Financial support for community based organizations that provide direct or indirect benefits to groups of youth
- Any charitable purpose or any non-commercial purpose that is beneficial to the whole or a section of the community
They are a reasonable player in this space. As at 31 December 2021, nationally they have around 2.3% of Class 4 machines under their management, although this varies by region: in Canterbury for example they have 4.4% of machines under management: in Waitaki that number increases to 22%.
They have a different model from some of the other for purpose Class 4 organisations, such as Air Rescue and Mainland Foundation. These guys show the distribution to the primary entities they support as a grant, whereas within Youthtown its simply in their financial accounts, not their grant distributions, as a (technical term) lump of cash to Youthtown.
I have forced the numbers to make them look like others to try to allocate those grants to a region.
- I’ve taken the figure from their annual reports called “Gaming Contribution”. Note by taking this figure I assume that the cost of making the grants is included in the line item “Gaming Indirect Costs”. (Note that right now you can’t access accounts from DIA’s website for organisations that are part of a group: there is a system issue. I asked nicely and a human sent them to me.)
- I’ve then looked to allocate those costs to the regions that the operator was in. To do this I looked at gaming machines under their management at the end of each year (data ex DIA).
- I then assumed 30% of the total Gaming contribution should be allocated nationally to cover head office costs, with the balance allocated to the regions as per above.
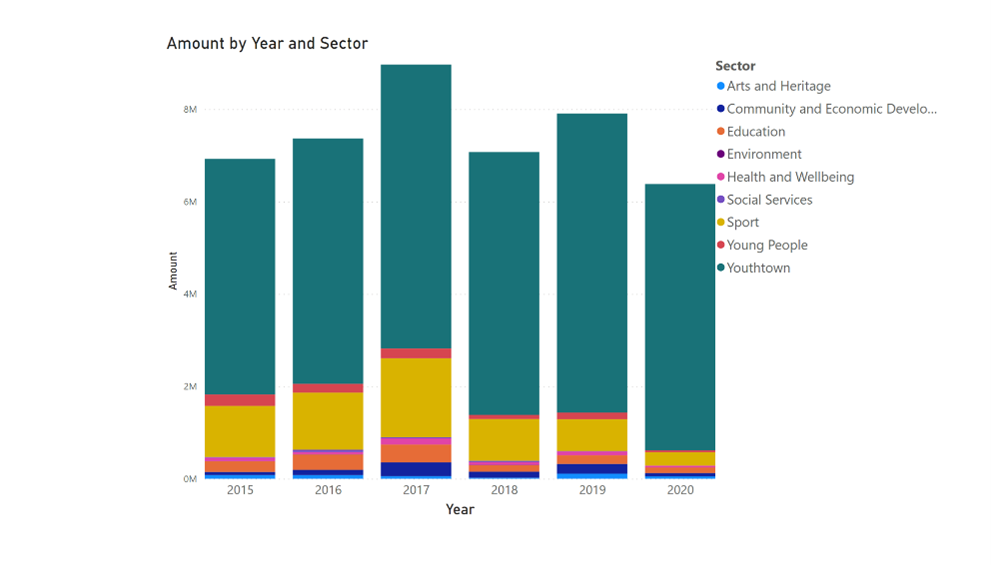
What is completely self evident (and not entirely unexpected) from the chart is that Youthtown grant themselves a significant portion of the proceeds generated by their machines. In the six years under review, they have granted themselves on average 78% of their grant proceeds, although this figure rose to 90% in 2020 due, I expect to COVID.
Machines under their management has bounced around a bit too: from 302 in 2015, up to 383 in 2020, and back down to 314 in 2021.
Machines under their management has bounced around a bit too: from 302 in 2015, up to 383 in 2020, and back down to 314 in 2021.
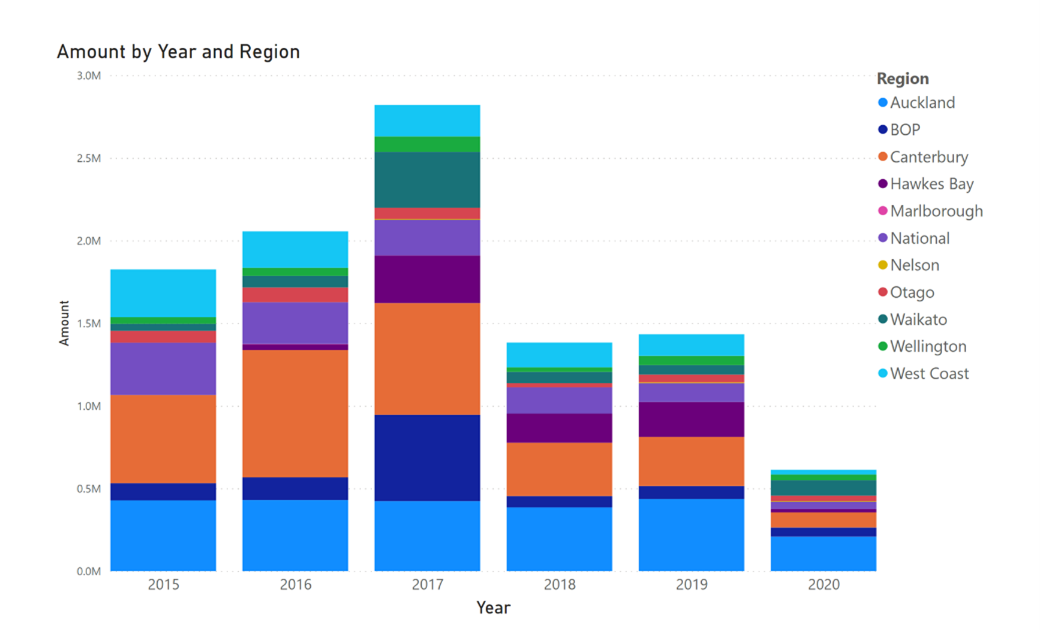
This chart looks at the NON Youthtown grants by region. Here you can see what money went where by year. You can also see better some of the peaks and troughs in the grant funding that has been available to community organisations between 2015 and 2020. National refers to organisations where I simply don’t know where the benefit of that grant money went: unlike others the disclosure from this funder aint that great. They don’t reveal the amount that was actually asked for, nor the territorial authority where the grant came from. However, based on what is provided it looks like the chances of a grant from Youthtown are fairly low: in 2018 71% of applicants were turned down for funding, 2019 the odds were better with a 61% rejection rate, but in 2020, somewhat unsurprisingly, the rejection figure was 79%. If you have been using my earlier work on demand for grant money in Canterbury, then you should add an extra $800k or so onto the Youth bar.
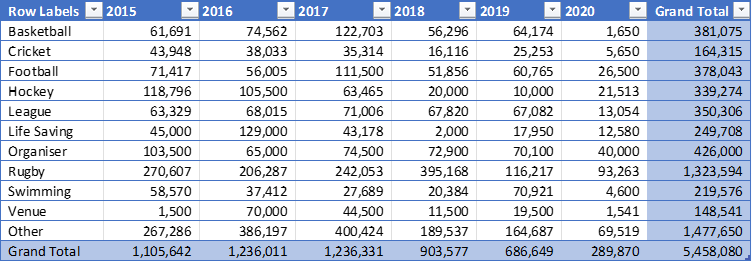
Because I always look at sport, and of course it’s the top sector for Youthtown to give to, below is a pivot table looking at the top 10 sports. Don’t think you’ll see any surprises in this.
Because I always look at sport, and of course it’s the top sector for Youthtown to give to, below is a pivot table looking at the top 10 sports. Don’t think you’ll see any surprises in this.
You may be looking at this and going “well that’s all very interesting but its now July 2022 so this data is two years old. The COVID period is actually where things get interesting. I agree. However, the 2020 – 2021 numbers are not published. Six weeks ago I did ask DIA who responded with the below from Youthtown.
As you know as an end user trust, we are not obligated to publish our grants data each year, although we often do, and at least publish a range of community grants. As the last two years were covid years, we like many community delivery organisations have struggled with the very impactful knock of lockdowns and managing our commitments to communities across New Zealand. We are happy to list the grants made as best practice and are busy compiling this for our website.
From the 2021 summarised published accounts I can see that they did give away $1,415,000 to 135 different organisations. I can’t quite figure out what they granted themselves as the only information I have is the summarised financials. I am surprised that they are listed as an end user trust – I guess I thought they were a corporate and had the same reporting obligations that the others do. In fact I didn’t realise there was a difference. However, I do agree that the provision of this information is best practice and that providing feedback on who got the funding is only fair to the likely 500 or so organisations who did apply and spent money on making applications. If we assume that each organisation took a day to apply (in terms of assembling background information, including the resolution etc, and the accountability report at the end….), then that’s around $300 / application = $150,000 for all those who applied for funds. Which is around 10% of the total money given away. This is why I rabbit on about cost to serve!
A chap I work with has shown me Power BI, so please excuse the playing with the graphics. I’m sure I’ll improve as time goes on…. Quite exciting to try out a few tool for this. I am also pretty keen to improve my database skills so hopefully pieces will fall into place so I can pull these various pieces together in a more cohesive ecosystem manner: shout out if you have any ideas around how I can do this and teach the old girl some new tricks.
I write about this stuff as believe that as need to understand where funding comes from, where it goes, and how it gets there. As a citizenry we allow both those supplying money and those asking for money to operate, and as a community we need to ensure we have oversight over the organisations they choose to fund. Love to talk with you if you think this is at all interesting, and if you want to dive into the data a bit more than happy to do so. Check out my website http://www.delfi.co.nz/
 RSS Feed