But I have time on my hands so started afresh with 5,046 lines of five years of grants data. Some two months later, much gnashing of teeth and questioning my life choices, here you have it.
They have venues throughout the country, with a particular historical strength in Rotorua. Indeed, the men who made the decisions on where the money goes are mostly based in Rotorua.
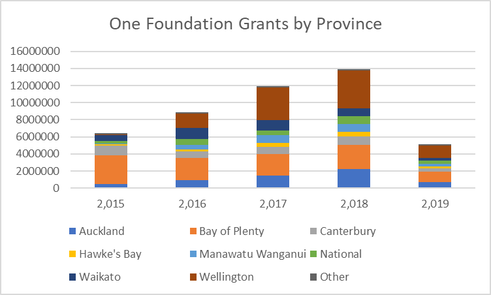
Looking at the past five years of data we can see a lot of growth in Wellington, and a bit in Manawatu Wanganui. It makes me wonder: Why the drop off in 2019? And what’s the grant growth in Wellington.
The second question is pretty interesting. I have looked at DIA data for venues over the past five years. Wellington region’s machines have grown from 8 machines at 31 December 2014 to an astonishing 205 at 30 September 2019. They picked up nine venues it seems in 2015, all from Infinity Foundation. I’d love to know the story behind that! I did try to see if that affected the grant decisions, but unfortunately Infinity Foundation only have their most recent financial year grants available on their website (again, really?) so I can’t dig. One Foundation’s numbers have held in other parts of the country, although they are now out of Queenstown, and numbers have halved in the Tauranga region. Auckland numbers also rose from 24 machines up to 78 in 2017, only to drop off again to 36.
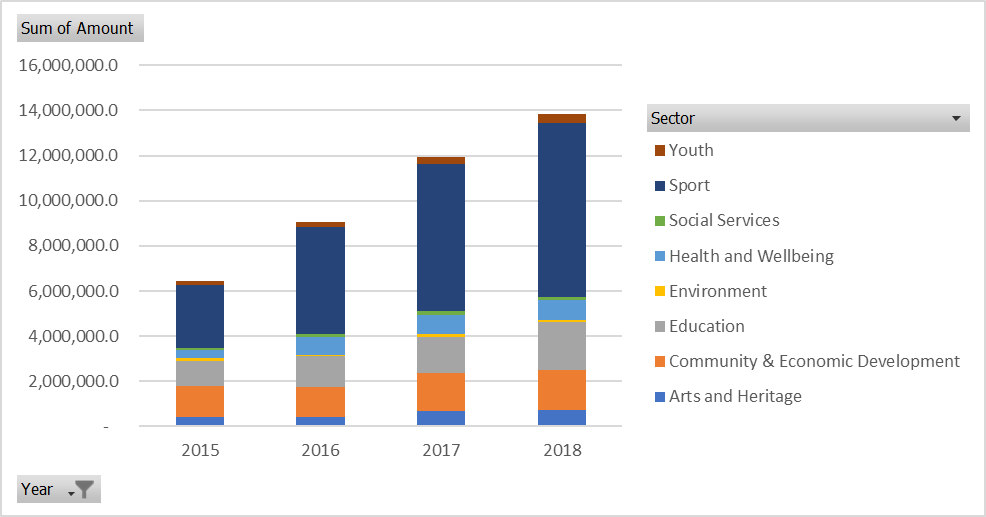
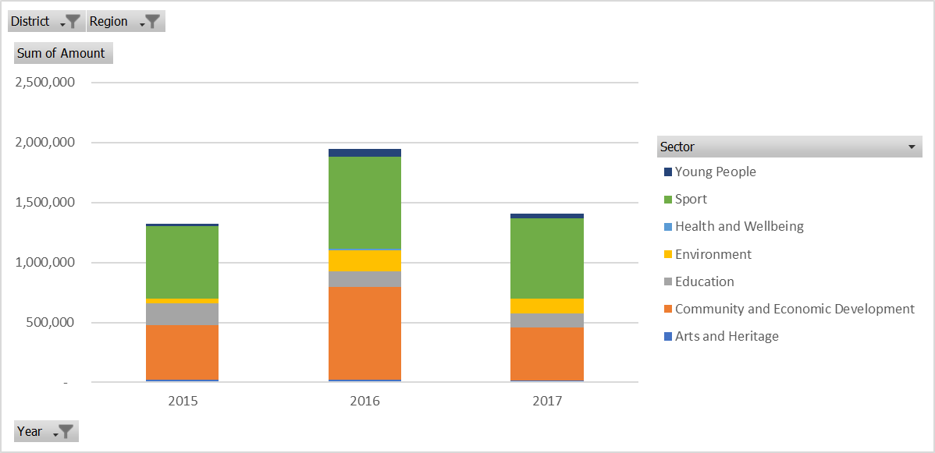
Then we can look at where the money goes. I’m only going to look at years where I have full data: 2015 – 2018. Money goes to all sorts of community organisations, with sport getting around half, and community and economic development, and education taking around 15% of the total given. They give an average of around $9,000 per grant, in 2018 made around 1,500 grants to 964 different organisations across the country.
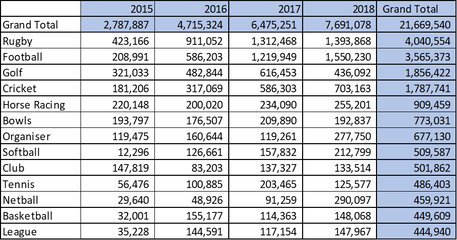
Sport? Well it’s a bit predictable: below is a wee table showing the top 11 codes over 2015 – 2018 financial year. Organiser is those organisations who run things (like Sport Canterbury) and Club is those clubs where several codes are offered under one entity.
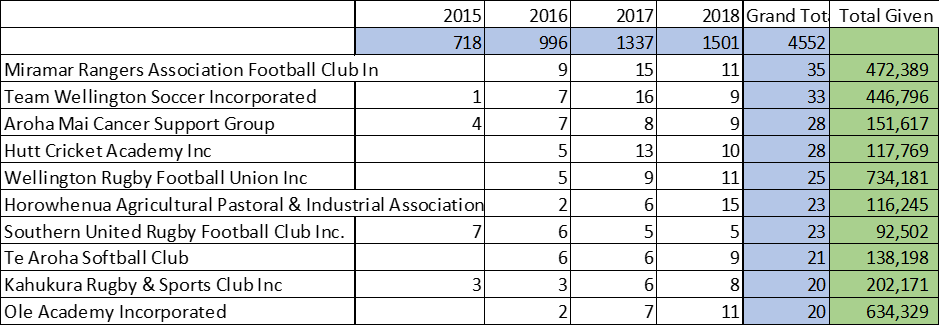
There are a bunch of groups that have received multiple grants in any one financial year. Below is a table showing the top number of grant writers and their successful applications.
One Foundation put around $14m into our communities through the operation of their gaming venues. Their processes are simple, they fund a lot of different organisations, but their disclosure leaves a bit to be desired. I’m a little uncomfortable too with those sitting around the table making decisions to fund specific organisations, and I can’t help wonder why all those Wellington venues came over to this organisation in 2015 and why they are so supportive of football in the capital. I also have not looked at who made up the $8.7m declined grants (2018). I have the data but I don’t find it quite as interesting. Let me know if you do!
I write about this stuff as believe that as need to understand where funding comes from, where it goes, and how it gets there. As a citizenry we allow both those supplying money and those asking for money to operate, and as a community we need to ensure we have oversight over the organisations they choose to fund. Love to talk with you if you think this is at all interesting, and if you want to dive into the data a bit more than happy to do so. Check out my website http://www.delfi.co.nz/



 RSS Feed