
Summer is quite stunning in the South Island. The trees are looking great. As I gazed at the view on Kina Beach in Tasman, I wondered how Rata Foundation had performed this year (tragic right). So I’ve had another wee gander at Rata Foundation’s grants and financials. They were published sometime in September for the year ending 31 March. They are pretty important in the grant funding ecosystem: from some older numbers they account for around a quarter of grants going into Canterbury organisations.
I last had a good look at Rata a year ago. Check out that blog and a few previous to see who this grant maker is and the genesis of their money. What I found there was some increases in the amounts given, to fewer groups. I had noted a change of trustees given the change of government (Trustees are appointed by the Minister of Finance) and wondered if there would be material changes in where the money goes. I found:
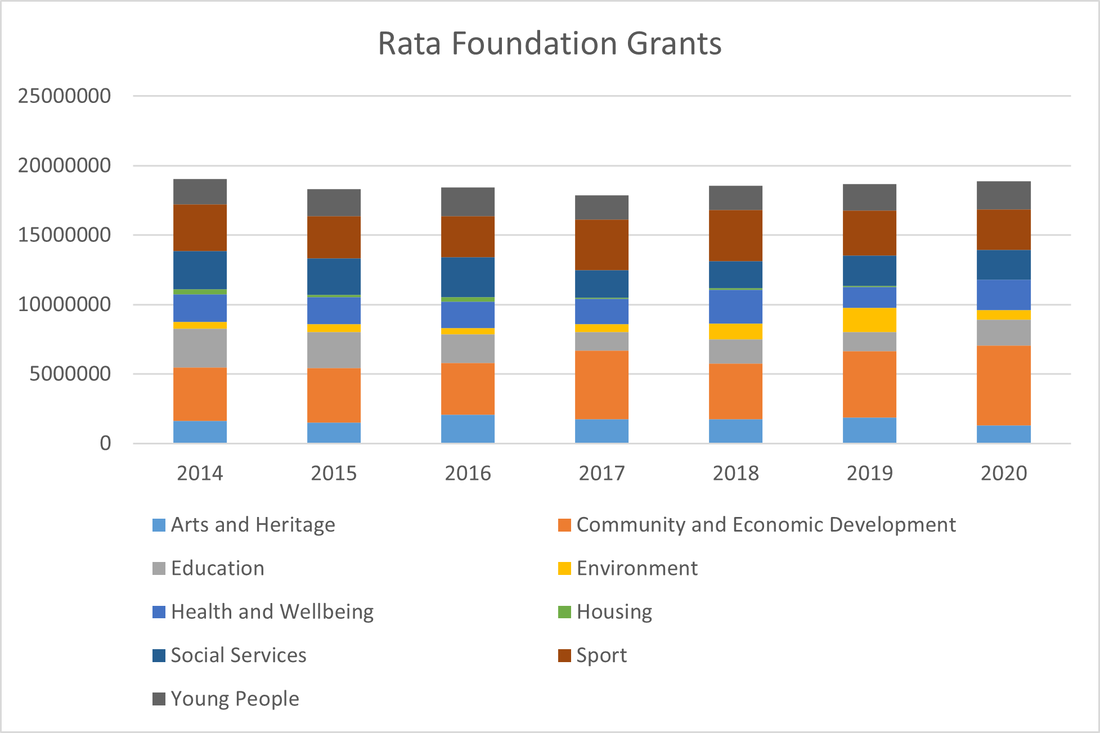
First things first: I’m moaning about the data. I use publicly available information, and over the years its got worse in terms of disclosure. Two years ago multi year grants were identified and the time span given. Now, not so much. This year I am throwing in the towel over allocating multi year funding over several years as I’m having to make far too many assumptions. What this will do is mess up the view of sector allocations on an annual basis. So the chart below shows the multi year allocations 2018 and 2019, but sadly not 2020. I’m not sure that this will affect the story at a high level, but will mess up if I start drilling down too much.
I’ve also given up on trying to figure out if spend is for operational purposes or capital. This information used to be published, now its not. It’s a shame, as is helpful for understanding funding of community assets. Grant decisions used to be published within weeks after the decision was made: now we have to wait for the annual report, in some cases up to 17 months, to see how the community funding decisions are made. Another useful piece that gaming trusts publish but these guys don’t is declined applications. That helps to give a view of where the organisation is making resource trade-offs and in my nerdy opinion can be pretty interesting.
Anyhoo… below is the last seven years of Rata grants (backing out the $25m Special Earthquake fund). What is rather interesting here is the drop in sport and the rise in community and economic development, which is 2020 made up around 30% of grants made. Over the last seven years the average was 24%.
I last had a good look at Rata a year ago. Check out that blog and a few previous to see who this grant maker is and the genesis of their money. What I found there was some increases in the amounts given, to fewer groups. I had noted a change of trustees given the change of government (Trustees are appointed by the Minister of Finance) and wondered if there would be material changes in where the money goes. I found:
- Top of the South (Nelson and Marlborough regions) got 30% of 2019 grants, whilst having 23% of the population
- Rugby is still the number one sport getting funding from Rata.
- They are giving fewer, bigger grants.
- The cost per grant has shot up by over $1500. This is driven by both rising costs and fewer grants.
First things first: I’m moaning about the data. I use publicly available information, and over the years its got worse in terms of disclosure. Two years ago multi year grants were identified and the time span given. Now, not so much. This year I am throwing in the towel over allocating multi year funding over several years as I’m having to make far too many assumptions. What this will do is mess up the view of sector allocations on an annual basis. So the chart below shows the multi year allocations 2018 and 2019, but sadly not 2020. I’m not sure that this will affect the story at a high level, but will mess up if I start drilling down too much.
I’ve also given up on trying to figure out if spend is for operational purposes or capital. This information used to be published, now its not. It’s a shame, as is helpful for understanding funding of community assets. Grant decisions used to be published within weeks after the decision was made: now we have to wait for the annual report, in some cases up to 17 months, to see how the community funding decisions are made. Another useful piece that gaming trusts publish but these guys don’t is declined applications. That helps to give a view of where the organisation is making resource trade-offs and in my nerdy opinion can be pretty interesting.
Anyhoo… below is the last seven years of Rata grants (backing out the $25m Special Earthquake fund). What is rather interesting here is the drop in sport and the rise in community and economic development, which is 2020 made up around 30% of grants made. Over the last seven years the average was 24%.
Its interesting to think about what is driving this change. We are seeing more cash injections going out to capability building, including almost $30k to a private group to run some work. We also have a different group of people making decisions around the Board table due to the change in government.
Below is a list of the top 10 grants made in 2020. Now remember some of these could well be multi year funding, others could be building projects. Others could just be really good projects! It’s hard to know: for some I have done a google to find out but was unable to do that consistently so not presented here.
Sporting venues are the most funded sporting groups with over $320k going to such venues. They tend to be multi sport ones like rec centres and the like. Within code Football is the favourite sport funded by Rata Foundation, with $250k given to the code, followed closely by Cricket at $235k. Basketball got $170k, organisers (such as Sport Canterbury) $170k, Life Saving $161k, Cycling $157k, Rugby, last year’s winner, got $151k, followed by Netball (!) at $120k. Loving the rise of Basketball here: it’s a growing code within the region.
Speaking of regions, the balance between Canterbury spend and Top of the South more reflects the population, with 77% of funds going to Canterbury organisations. Last time I looked Top of the South got 30% of funds despite having 23% of the population.
If you are interested in looking at this a bit more, please get in touch.
Now, cost to serve is an interesting view. You may have seen a look at the Christchurch Foundation recently. They do a different job that Rata of course: in addition to managing funds and making grants they also have to build the capital fund by finding donors and asking for money.
With Rata I’ve had a look at a history of operating financials. In 2014, the costs per grant made were 14.8 cents. This means that for every dollar given, it cost 14.8 cents to get that dollar into the community. In 2020, that cost has gone to 19.9 cents. This growth is driven by an increase in fund management costs (perhaps using different methodologies), and salaries up 60%. In 2014 the cost per grant was $2,263. In 2020 it is $4,376.
Now, another interesting figure is the top staff costs. In 2016, the first year this data was published, that number was $654k. This was over the top five staff. The top five salaries went up $18k in the next year to bring an average top five salary of $124,400 in 2017. In, 2018 there is a drop in the gross figure. Its now $549k. However, now it’s over the top three staff. In 2019 this number increased by $50,000, and in 2020 by $26,000. Dividing that 2020 top staff number by 3 gives us an average salary of $209k. What are your views on this? How does it sit with others in the third sector? I should look at that!
If the grant decisions made now are wiser than before then absolutely. But the data suggests that just over half of groups getting funding in 2020 usually get funding. 14% of grants were brand new grantees to Rata, although eyeballing the list many were usual suspects to other funding channels. Does the increase in costs mean our community has had better investments made into it? Well this isn’t measured – and quite frankly would be jolly difficult to measure at least using public information. Happy to talk if you have some ideas on this.
I write about this stuff as believe that as need to understand where funding comes from, where it goes, and how it gets there. As a citizenry we allow both those supplying money and those asking for money to operate, and as a community we need to ensure we have oversight over the organisations they choose to fund. Love to talk with you if you think this is at all interesting, and if you want to dive into the data a bit more than happy to do so. Check out my website http://www.delfi.co.nz/
Below is a list of the top 10 grants made in 2020. Now remember some of these could well be multi year funding, others could be building projects. Others could just be really good projects! It’s hard to know: for some I have done a google to find out but was unable to do that consistently so not presented here.
- CORE Education $654,325
- University of Canterbury- A Better Start $367,083
- Bone Marrow Cancer Trust $250,000
- He Waka Hou Trust $250,000
- Community Wellbeing North Canterbury Trust $240,000
- St John of God Hauora Trust (Waipuna) $240,000
- Te Whatu Manawa Maoritanga o Rehua Trust $233,333
- Te Ora Hou Otautahi Inc $233,333
- LEAD Centre for Not for Profit Leadership $201,966
- Whakatu Te Korowai Manaakitanga Trust $186,000
Sporting venues are the most funded sporting groups with over $320k going to such venues. They tend to be multi sport ones like rec centres and the like. Within code Football is the favourite sport funded by Rata Foundation, with $250k given to the code, followed closely by Cricket at $235k. Basketball got $170k, organisers (such as Sport Canterbury) $170k, Life Saving $161k, Cycling $157k, Rugby, last year’s winner, got $151k, followed by Netball (!) at $120k. Loving the rise of Basketball here: it’s a growing code within the region.
Speaking of regions, the balance between Canterbury spend and Top of the South more reflects the population, with 77% of funds going to Canterbury organisations. Last time I looked Top of the South got 30% of funds despite having 23% of the population.
If you are interested in looking at this a bit more, please get in touch.
Now, cost to serve is an interesting view. You may have seen a look at the Christchurch Foundation recently. They do a different job that Rata of course: in addition to managing funds and making grants they also have to build the capital fund by finding donors and asking for money.
With Rata I’ve had a look at a history of operating financials. In 2014, the costs per grant made were 14.8 cents. This means that for every dollar given, it cost 14.8 cents to get that dollar into the community. In 2020, that cost has gone to 19.9 cents. This growth is driven by an increase in fund management costs (perhaps using different methodologies), and salaries up 60%. In 2014 the cost per grant was $2,263. In 2020 it is $4,376.
Now, another interesting figure is the top staff costs. In 2016, the first year this data was published, that number was $654k. This was over the top five staff. The top five salaries went up $18k in the next year to bring an average top five salary of $124,400 in 2017. In, 2018 there is a drop in the gross figure. Its now $549k. However, now it’s over the top three staff. In 2019 this number increased by $50,000, and in 2020 by $26,000. Dividing that 2020 top staff number by 3 gives us an average salary of $209k. What are your views on this? How does it sit with others in the third sector? I should look at that!
If the grant decisions made now are wiser than before then absolutely. But the data suggests that just over half of groups getting funding in 2020 usually get funding. 14% of grants were brand new grantees to Rata, although eyeballing the list many were usual suspects to other funding channels. Does the increase in costs mean our community has had better investments made into it? Well this isn’t measured – and quite frankly would be jolly difficult to measure at least using public information. Happy to talk if you have some ideas on this.
I write about this stuff as believe that as need to understand where funding comes from, where it goes, and how it gets there. As a citizenry we allow both those supplying money and those asking for money to operate, and as a community we need to ensure we have oversight over the organisations they choose to fund. Love to talk with you if you think this is at all interesting, and if you want to dive into the data a bit more than happy to do so. Check out my website http://www.delfi.co.nz/
 RSS Feed